The economy is getter better, isn’t it? It seems that no matter how hard the New Zealand government tries to convince us there are a range of statistics released from it’s own departments that pour cold water on the notion of any kind of strong economic recovery. Unemployment hitting the highest rate in 12 years is just one of those statistics.
So what does this really mean for the future?
Chris Martenson from Peak Prosperity recently wrote a great article called The Real Reason the Economy Is Broken (and Will Stay That Way). He referenced Gail Tverberg’s work on investment sinkholes and the link between oil consumption and GDP.
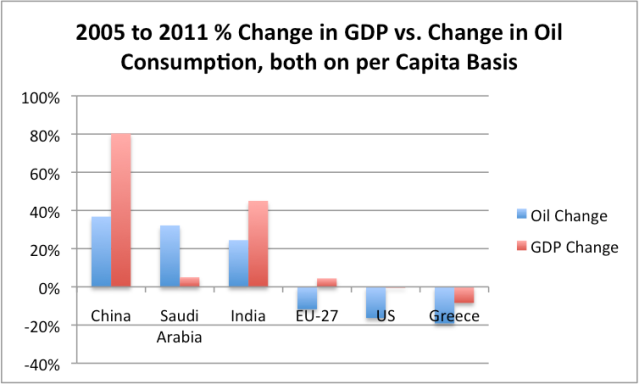
Figure 1: Comparison of 2005 to 2011 percent change in real GDP vs percent change in oil consumption, both on a per capita basis. (GDP per capita on a PPP basis from World Bank, oil consumption from BP’s 2012 Statistical Review of World Energy.) Source
Martenson explains:
Oil and GDP are highly correlated and always have been. The general observation is that growth in GDP is usually higher than growth in oil consumption - as growth in oil consumption powers economic growth. Without growth in oil consumption, GDP growth doesn't advance.
So if we run some similar numbers for New Zealand how do we fare, given our high oil consumption per capita (38th in the world) and reliance on primary industries as the basis of our economy?
 Figure 2: Comparison of 2005 to 2011 percent change in real GDP vs percent change in daily oil consumption, both on a per capita basis. (GDP per capita on a PPP basis from World Bank, oil consumption from BP’s 2012 Statistical Review of World Energy, NZ population data from Statistics New Zealand.)
Martenson:
Back in 2009, in a piece entitled Oil - The Coming Supply Crunch (Part I), I calculated that every 1% increase in global GDP was associated with a 0.25% increase in oil consumption – in other words, a roughly 4:1 ratio.
Based on Figure 2 the ratio for New Zealand over this period is a 0.6% increase in GDP associated with a 0.25% increase in oil consumption which falls well below the global average.
That being said, compared to the Eurozone and the United States the New Zealand economy hasn’t fared too badly. While there has still been economic contraction and rising unemployment we are still a lot better off than our foreign neighbours. Figure 2 shows that GDP per capita rose just shy of 19 percent over the 2005-2011 period while oil consumption has risen just under eight percent. One of the New Zealand’s economies saving graces has been the 2008 free trade deal with China. Exports to China rose $1.5 billion (37 percent) in 2010.

Figure 3: New Zealand GDP per capita vs. daily consumption of oil per capita. (GDP per capita on a PPP basis from World Bank, oil consumption from BP’s 2012 Statistical Review of World Energy, NZ population data from Statistics New Zealand.)
Figure 3 shows we have seen GDP per capita rising steadily for the last 30 years with a flattening off after the global financial crisis. Over this period we also see the consumption of oil per capita peak during the consumerist decade of the 80s and then more or less decline.
Martenson:
Since 2007, something quite remarkable has happened in the world of oil, and that has been a decline in the consumption of oil in the U.S. and Europe -- with China and India pretty much making up the difference for everything that the West didn't consume.
New Zealand’s oil consumption per capita has actually increased from 2007, most probably due to growth in fossil fuel reliant primary industries. But before that period GDP steadily grew while oil consumption steadily fell. How do we reconcile that with Chris Martenson’s view that “without growth in oil consumption, GDP growth doesn't advance.”?
As with most things economic it’s not quite that simple. Gail Tverberg explains further:
In Figure 1, we see that for several groupings, the increase (or decrease) in oil consumption tends to correlate with the increase (or decrease) in GDP. The usual pattern is that GDP growth is a little greater than oil consumption growth. This happens because of changes of various sorts: (a) Increasing substitution of other energy sources for oil, (b) Increased efficiency in using oil, and (c) A changing GDP mix away from producing goods, and toward producing services, leading to a proportionately lower need for oil and other energy products.
The situation is strikingly different for Saudi Arabia, however. A huge increase in oil consumption (Figure 1)…does not seem to result in a corresponding rise in GDP.
New Zealand matches up with both (a) and (b) causing per capita oil consumption to decrease. However given our export based economy, (c) does not ring true at all. Most of our economic growth has come from an intensification of farming practices (mainly dairy), more efficient forestry practices and a large increase in crude oil exports. This coupled with new markets such as China has been a great benefit to New Zealand.
The trouble is when we are so reliant on other countries economies being strong we are incredibly vulnerable when they weaken. There is already murmurs that the commodity boom in Australia is on shaky ground and that the aging population of China spells real trouble when a huge proportion of the population can’t work and needs to be supported. If we want to know how New Zealand economy will do in the future these are the two key countries to watch.
So while we might be doing ok for now, unless our current trading partners perform miracles and stay strong for the foreseeable future don’t expect the New Zealand economy to get much better than this.
No comments:
Post a Comment